Every property developer who invests in 3D visualization asks the same question: does it actually pay off? The short answer is yes - and the data is compelling. In this article, we go beyond anecdotal evidence and examine the real numbers behind the return on investment of architectural visualization in the DACH market. From pre-sale acceleration to reduced carrying costs, from higher per-square-meter prices to marketing efficiency gains - we lay out the case studies and data points that make visualization one of the highest-ROI investments in real estate development.
Key finding: Property developers in Austria report that projects marketed with professional 3D visualizations achieve 25-40% higher pre-sale rates before construction start and reduce the average sales cycle by 2-4 months compared to projects marketed with construction site photos alone.
The Core ROI Drivers of Architectural Visualization
The return on investment from 3D visualization comes from multiple channels, and they compound. Understanding each driver helps you quantify the expected return for your specific project.
1. Pre-Sale Acceleration
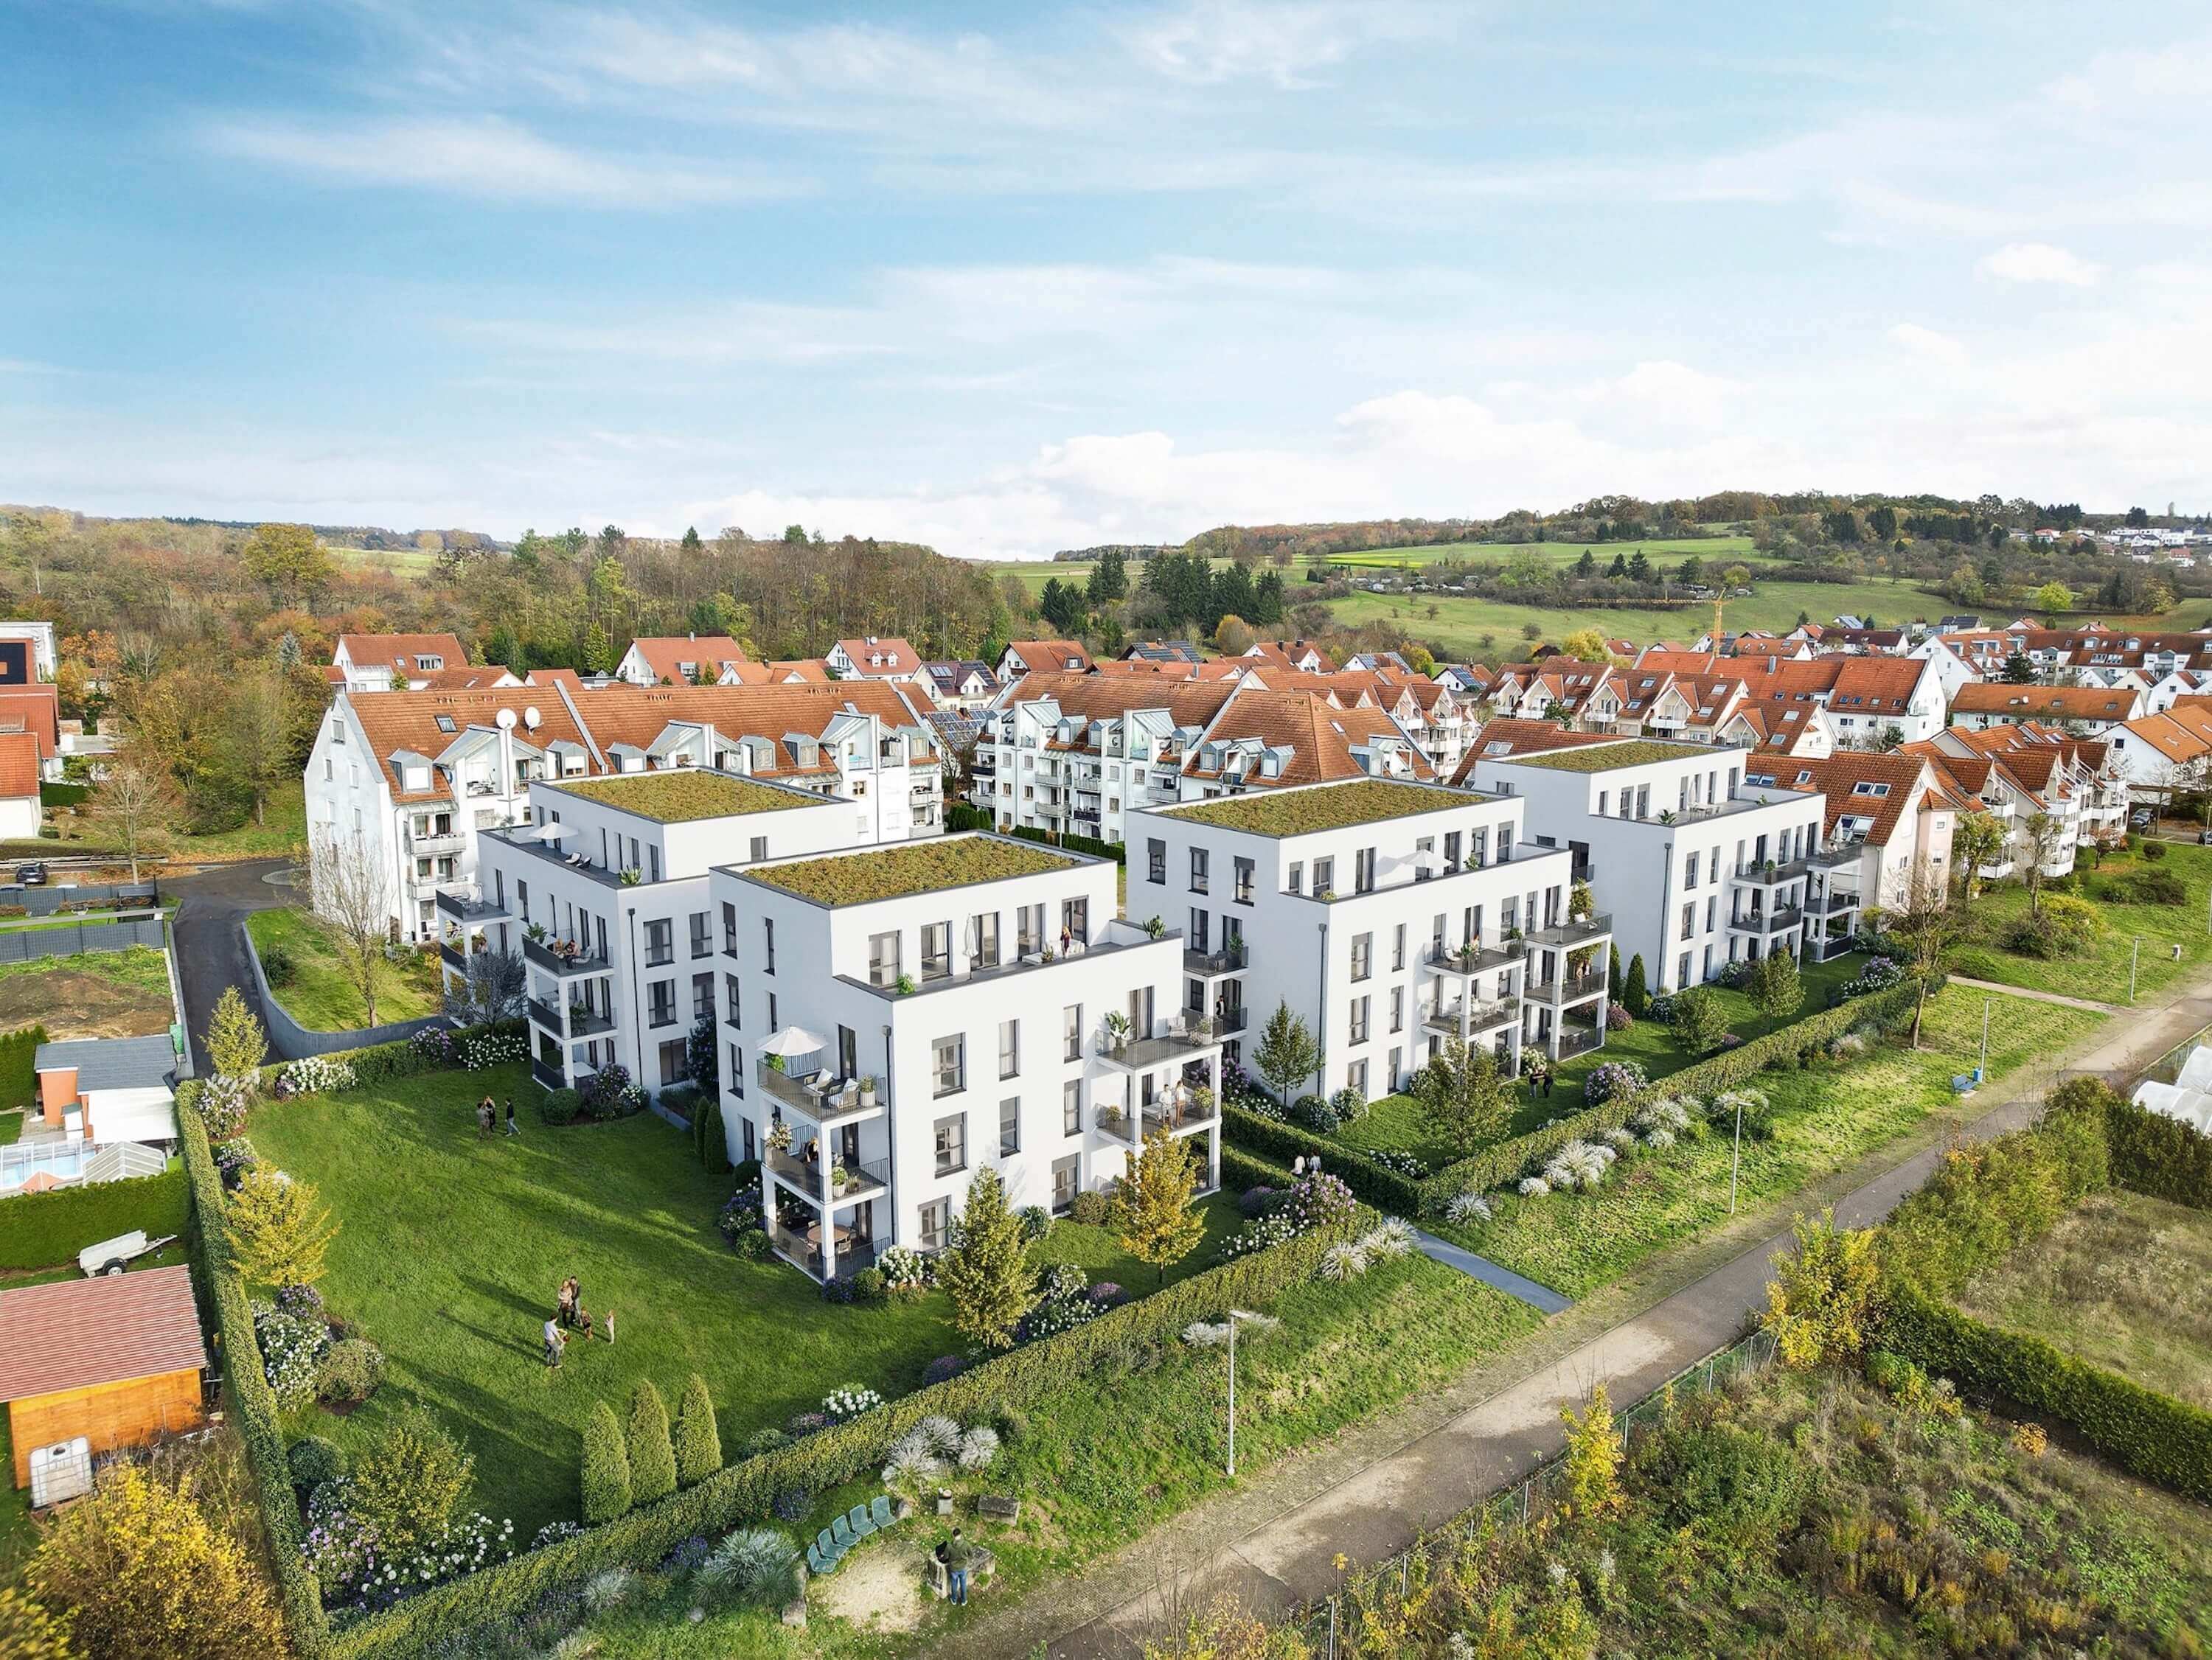
The most significant ROI driver is the ability to start selling before the building exists. Without visualization, marketing a development project means showing floor plans, location maps, and perhaps construction progress photos. With photorealistic 3D renderings, you can launch a full marketing campaign the moment the building permit is issued - sometimes even earlier.
In the Austrian market, developments marketed with professional visualization packages consistently achieve higher pre-sale rates. Industry data suggests that projects with comprehensive visual materials (exterior renderings, interior visualizations, 3D floor plans, and virtual tours) reach 60-80% pre-sale before construction start, compared to 30-50% for projects relying on traditional materials alone. This difference of 20-30 percentage points in pre-sale rate translates directly into reduced financing risk and improved cash flow.
For a 30-unit development with an average unit price of EUR 350,000, the difference between 50% and 75% pre-sale at construction start represents approximately EUR 2.6 million in accelerated revenue. Against a visualization investment of EUR 10,000-15,000, the ROI calculation is straightforward.
2. Reduced Time on Market
Every month a property remains unsold costs the developer money - in financing costs, opportunity costs, and operational overhead. In Austria, carrying costs for unsold residential inventory typically range from EUR 1,500-4,000 per unit per month, depending on financing structure and location.
Professional visualizations reduce time on market by making properties more attractive and more comprehensible in online listings. Studies from German property portals indicate that listings with 3D visualizations receive 40-60% more engagement (clicks, inquiries, viewings) compared to listings with only photography or floor plans. Higher engagement translates to faster sales cycles.
"Before we started using 3D visualization, our average project sold out in 14 months after completion. Now, with professional renderings and virtual tours launched 6 months before completion, most projects are 90% sold by the time the building is handed over. The reduction in carrying costs alone justifies the visualization investment ten times over." - Property developer, Vienna

3. Price Premium
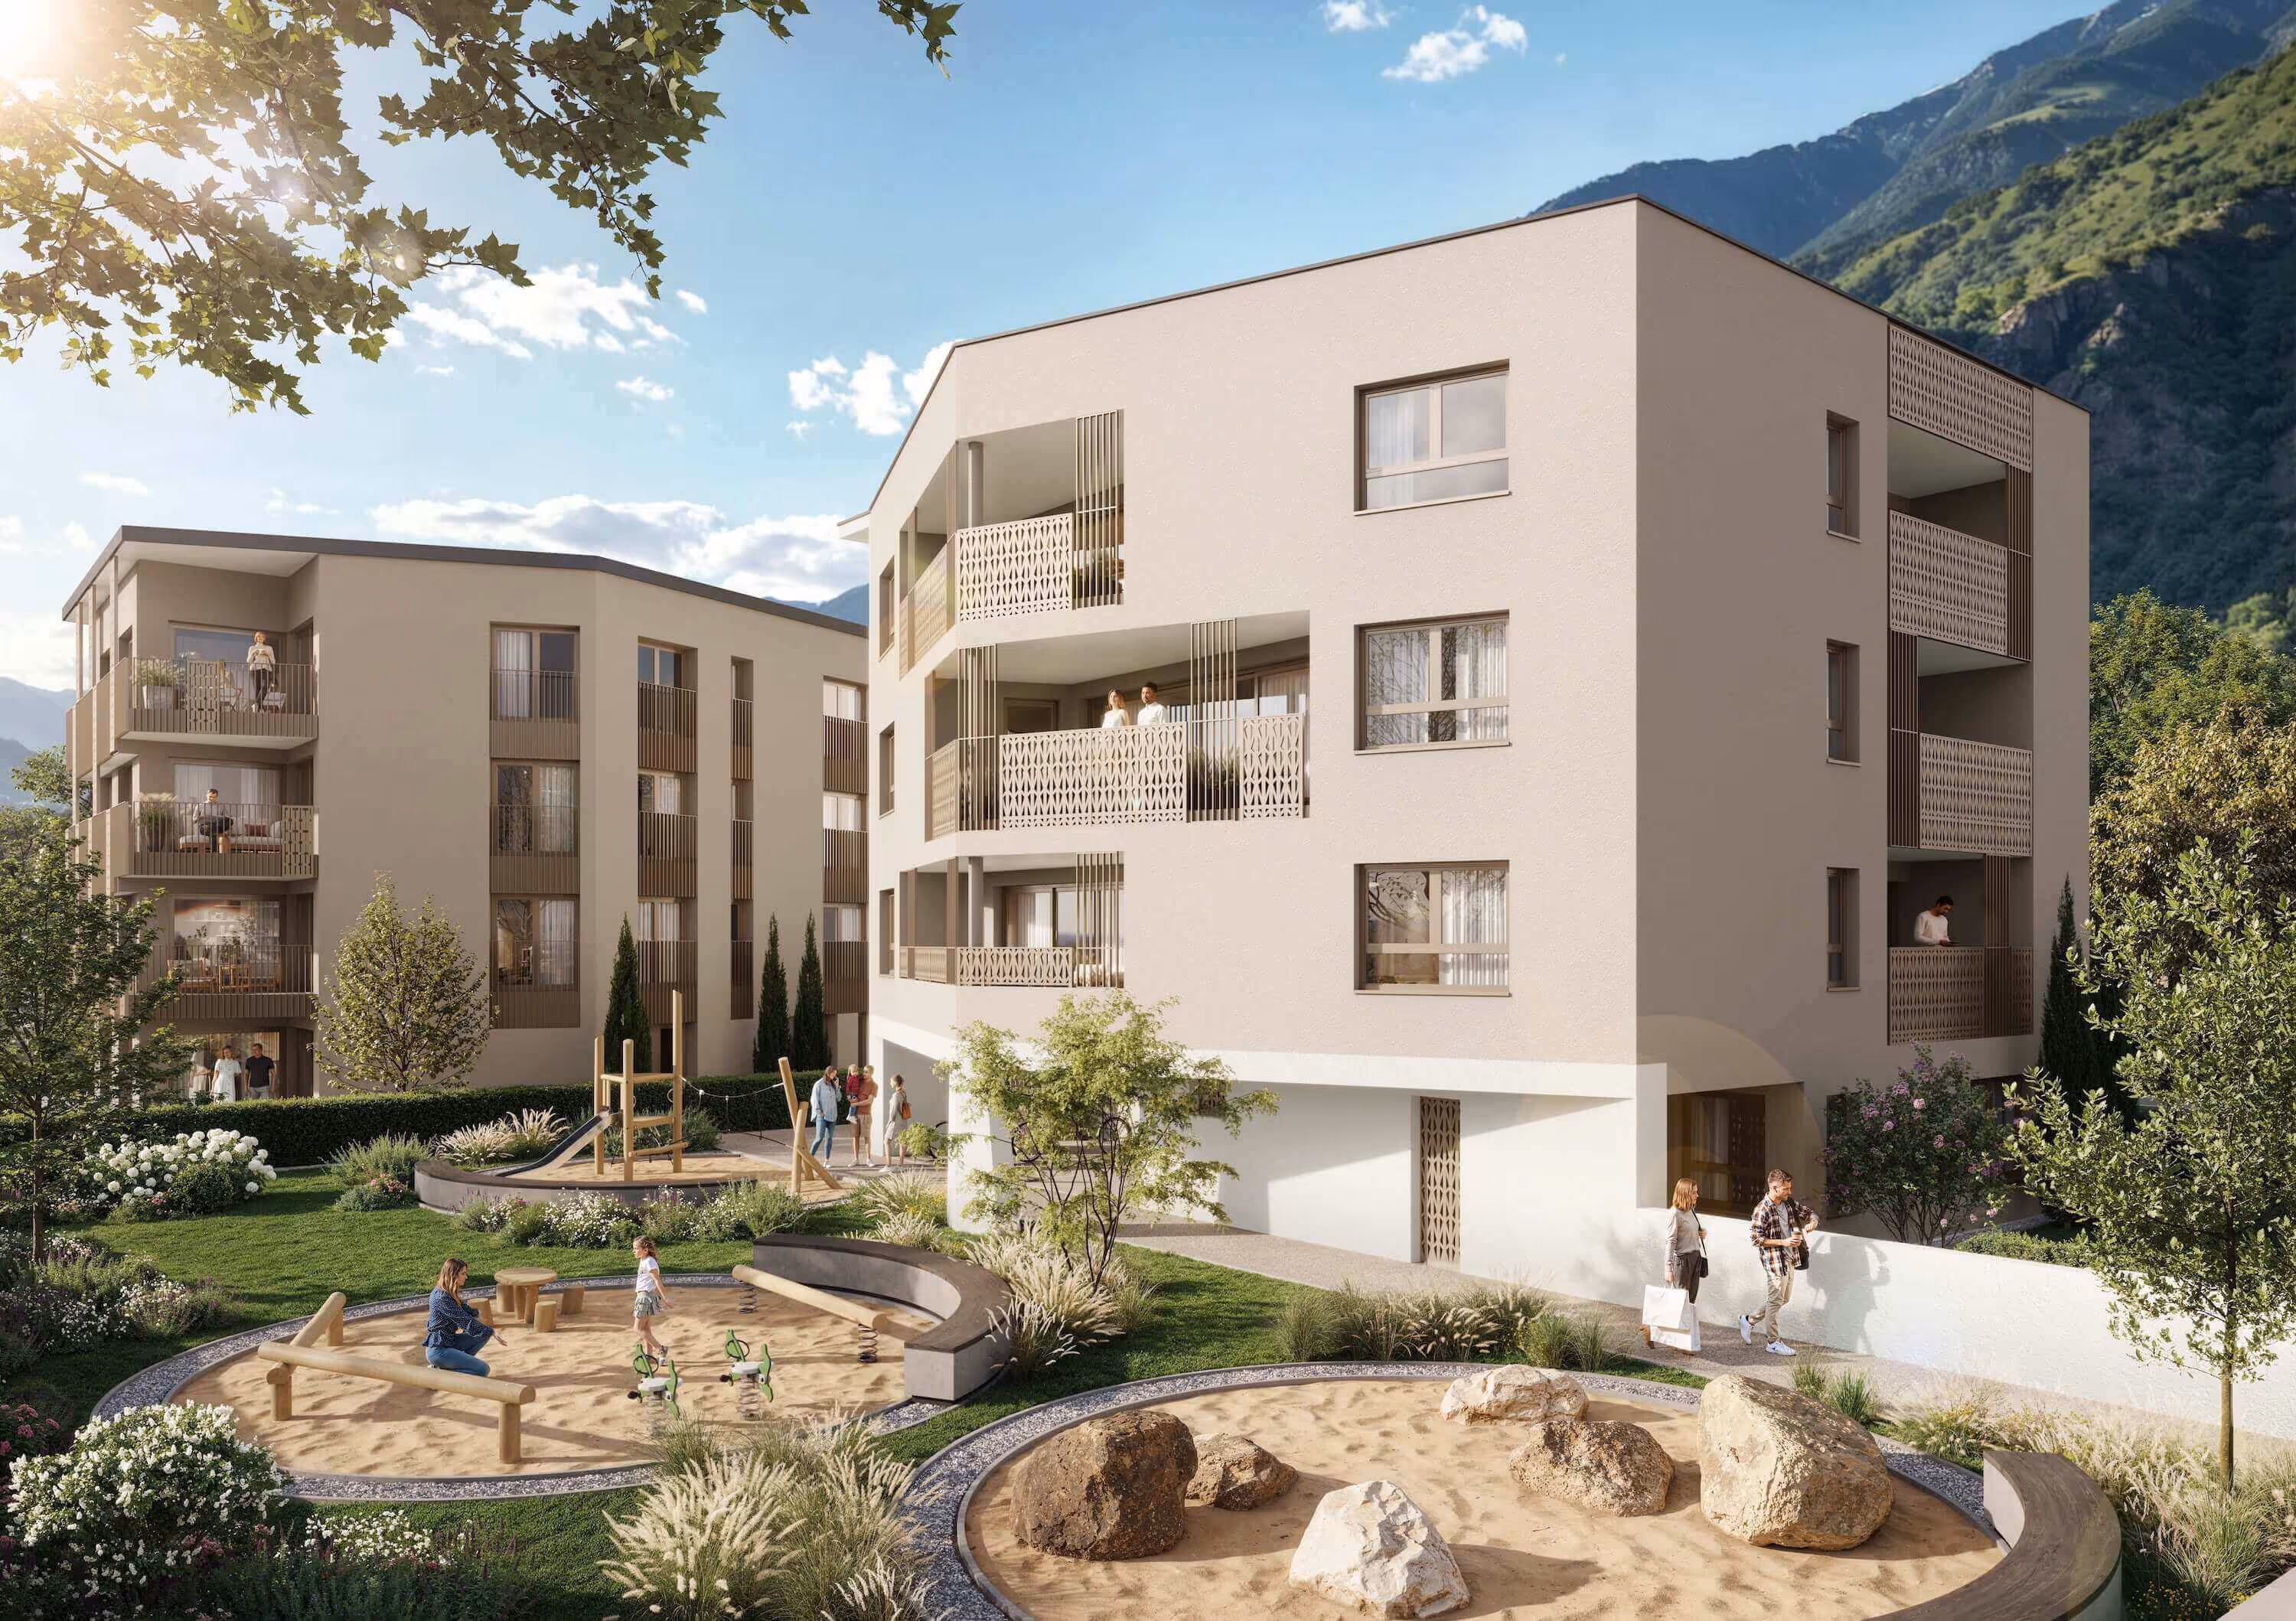
High-quality visualization does not just sell faster - it can help achieve higher prices. When buyers can clearly see and emotionally connect with a future property, their willingness to pay increases. This is particularly true for premium and luxury segments where the aesthetic experience is a significant part of the value proposition.
Several Austrian Bauträger report that units marketed with comprehensive visualization packages - including interior renderings, 3D floor plans, and 360-degree tours - achieve 3-7% higher per-square-meter prices compared to similar projects marketed with basic materials. On a EUR 350,000 apartment, a 5% premium represents EUR 17,500 - well above the cost of the entire visualization package.
4. Marketing Efficiency
Visualization assets are remarkably versatile. A single set of renderings and animations can power every marketing channel simultaneously: project website hero images, social media advertising content, print brochures and flyers, sales office displays, property portal listings, investor presentations, and email marketing campaigns. This multi-channel utility means you avoid producing separate visual assets for each platform - a significant cost saving compared to the alternative of commissioning photography, videography, and graphic design separately for each use case.
Case Study: Residential Development in Graz
To illustrate these ROI drivers in practice, consider a real project from the Austrian market.
A Graz-based developer launched a 42-unit residential project with a total sales volume of approximately EUR 14 million. The visualization investment consisted of 4 exterior renderings, 6 interior renderings across 3 apartment types, 3D floor plans for all unit configurations, a 60-second CGI animation, and a virtual tour of the flagship apartment. The total visualization cost was EUR 12,500.
The marketing campaign launched 8 months before estimated completion. Within 4 months, 28 of 42 units (67%) were reserved. By completion, only 3 units remained unsold - and those sold within 6 weeks of handover. The developer estimated that without visualization, the project would have followed the typical pattern of 40-45% pre-sale with full sell-out 6-8 months after completion.
The financial impact: approximately 4-5 months of reduced carrying costs across the remaining units, plus the eliminated risk of price reductions to move unsold inventory. The developer estimated the total value created by visualization at EUR 120,000-180,000 - a 10-14x return on the EUR 12,500 investment.
ROI formula: (Months saved x carrying cost per month x unsold units) + (price premium x units sold) / visualization cost = ROI multiple. For most DACH residential projects, this formula yields a 5-20x return.
ROI by Project Type
The return on visualization investment varies by project type, scale, and market segment. Here is how the ROI landscape breaks down across the DACH market.
Residential Developments (Highest ROI)
Residential projects consistently deliver the highest visualization ROI because of their direct sales model, high unit values, and long sales cycles. The combination of pre-sale acceleration, reduced carrying costs, and price premium effects compounds to produce returns of 5-20x on visualization investment. This is true for both large-scale developments and smaller projects of 6-12 units. For a detailed analysis, see our guide on visualization benefits for property sales.
Hotel and Tourism Projects
For hotel and tourism developments, visualization ROI comes through two channels: investor confidence (for funding) and pre-booking/marketing (for revenue). A compelling project film or rendering set can be the deciding factor in securing construction financing. In the Alpine tourism market, where competition for attractive development sites is intense, professional visualization has become a prerequisite for serious investor presentations.
Commercial and Industrial Projects
Commercial real estate and industrial developments see ROI primarily through tenant acquisition and corporate decision-making efficiency. Visualization helps corporate tenants make faster lease commitments, reducing vacancy periods. For industrial companies building new facilities, exterior visualizations support planning approval processes and stakeholder communication.
The Hidden ROI: Fewer Mistakes and Better Decisions
Beyond direct financial returns, architectural visualization generates significant hidden value through better decision-making during the design process.
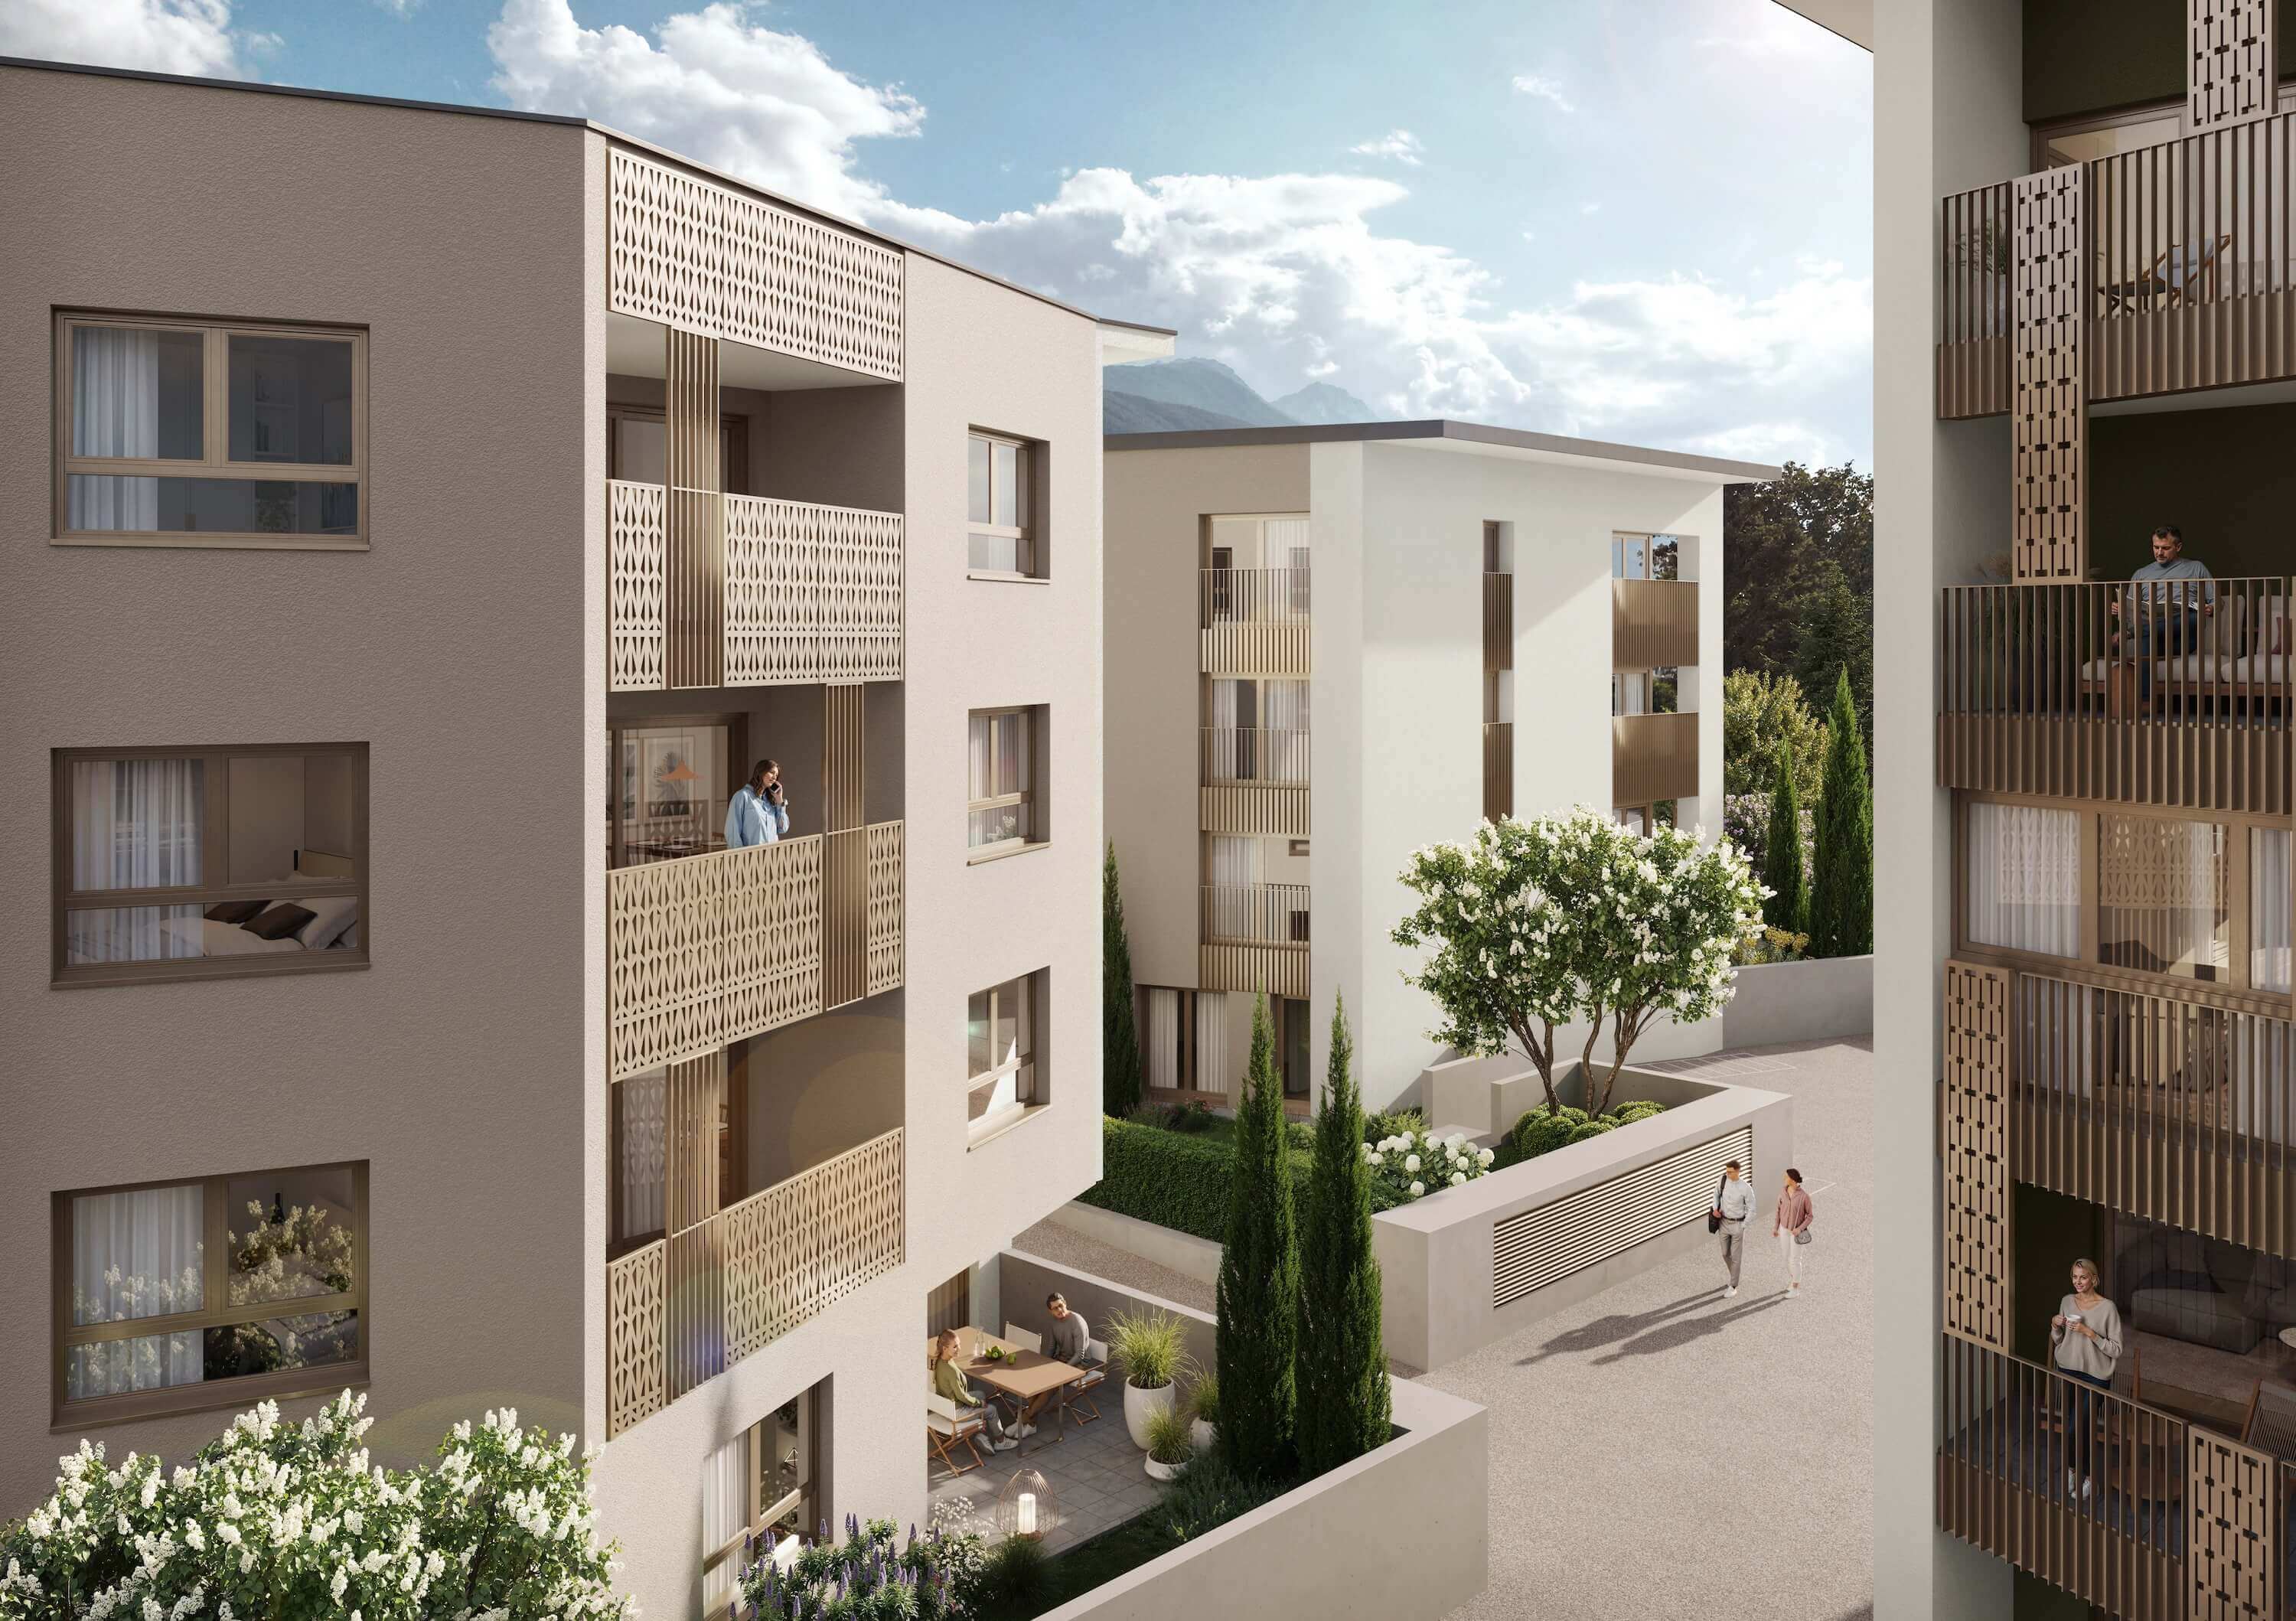
When stakeholders can see a photorealistic preview of the building, design issues surface earlier. Material choices that look good on a sample board but wrong at building scale become apparent. Spatial relationships that work on paper but feel awkward in three dimensions are caught before concrete is poured. Color schemes, facade treatments, and landscaping designs can be tested and optimized without physical mockups.
These design improvements - enabled by visualization - prevent costly change orders during construction. In the Austrian construction market, change orders typically cost 3-8x more than the equivalent design change. A single material change caught during the visualization phase that would have required physical modification during construction can save EUR 15,000-50,000.
"We now treat visualization as an essential part of the design process, not just marketing. Our 3D renderings have caught facade material issues, parking layout problems, and balcony proportioning errors that would have been extremely expensive to fix during construction. The design optimization alone justifies our visualization budget."
How to Maximize Your Visualization ROI
Based on the data and case studies from the DACH market, here are the strategies that consistently produce the highest returns.
Start early. The earlier you invest in visualization, the more marketing time you gain. The ideal moment is as soon as building plans are finalized - typically 6-12 months before estimated completion. Every month of early marketing translates to potential pre-sales.
Invest in a complete package. The ROI of a visualization package is significantly higher than individual assets. When you combine exterior renderings, interior renderings, 3D floor plans, and a virtual tour, each element reinforces the others. The package cost is lower per asset, and the marketing impact is multiplicative.
Use every channel. The visualization assets you commission should work across all your marketing channels - web, social media, print, sales office, portals, and presentations. Brief your studio on all intended uses so they deliver the right formats and resolutions.
Track and measure. Set up tracking for your visualization-driven marketing. Monitor portal engagement metrics, website time-on-page with visual content, and - most importantly - the correlation between visualization launch and sales velocity. This data informs future visualization investments.
The evidence is clear: for property developers, real estate agents, and hospitality investors across Austria, Germany, and Switzerland, architectural visualization is not a cost center - it is a profit multiplier. The question is not whether to invest, but how much and how early. For help planning your visualization investment, explore our comprehensive pricing guide or studio selection checklist.

Sell Faster. Impress More. Close Deals with Stunning Architectural Renderings.
Join top real estate professionals and developers using high-end visualizations to attract buyers and close deals with confidence.